Winding the spring:
Decoding contrarian market indicators
Key takeaways:
- Extreme pessimism in investor surveys may show that the recent decline in stocks has reached a capitulation point.
- While contrarian market signals often precede significant market rebounds, investors should not expect a V-shaped recovery.
04/30/2025 – The saying, "There are decades when nothing happens, and weeks when decades happen," perfectly encapsulates the past month in the financial markets. During this period, stock indices and investor sentiment both plummeted because of ongoing policy uncertainty.
Trouble had been brewing even before the Trump administration's consequential tariff announcement on April 2. When the S&P 500® Index hit a new all-time high on February 19, a subtle undercurrent of anxiety—fueled by discussions of punitive tariffs—showed that investor sentiment was not as optimistic as it seemed in the early days of 2025.
This unease cascaded into pessimism over the following weeks, as the S&P 500 flirted with a bear market correction. Last week, the benchmark U.S. stock index rebounded from its recent lows, as washed-out readings of market breadth metrics and sentiment surveys gave investors pause. These surveys suggested that the stock downdraft may have reached a capitulation point.
As of this writing, the American Association of Individual Investors (AAII) sentiment survey has marked its ninth consecutive week of majority bearish sentiment, setting a record for this gauge and representing two standard deviations below its historical average. Additionally, the Investors Intelligence survey shows extreme bearishness, and most measures of institutional positioning, such as Deutsche Bank Consolidated Positioning, show an underweighting of U.S. stocks.
Taken together, these various sentiment surveys may represent a powerful contrarian signal. Since 2020, retail investors, unlike their institutional counterparts, have noticed this signal and aggressively been buying into the recent selloff.
As we have previously noted, various measures of sentiment and market breadth have been very pessimistic lately. With institutional investor positioning and sentiment extremely negative, we can examine the percentage of S&P 500 stocks trading above their 200-day moving averages to illustrate how policy uncertainty has driven the market to its current oversold levels.
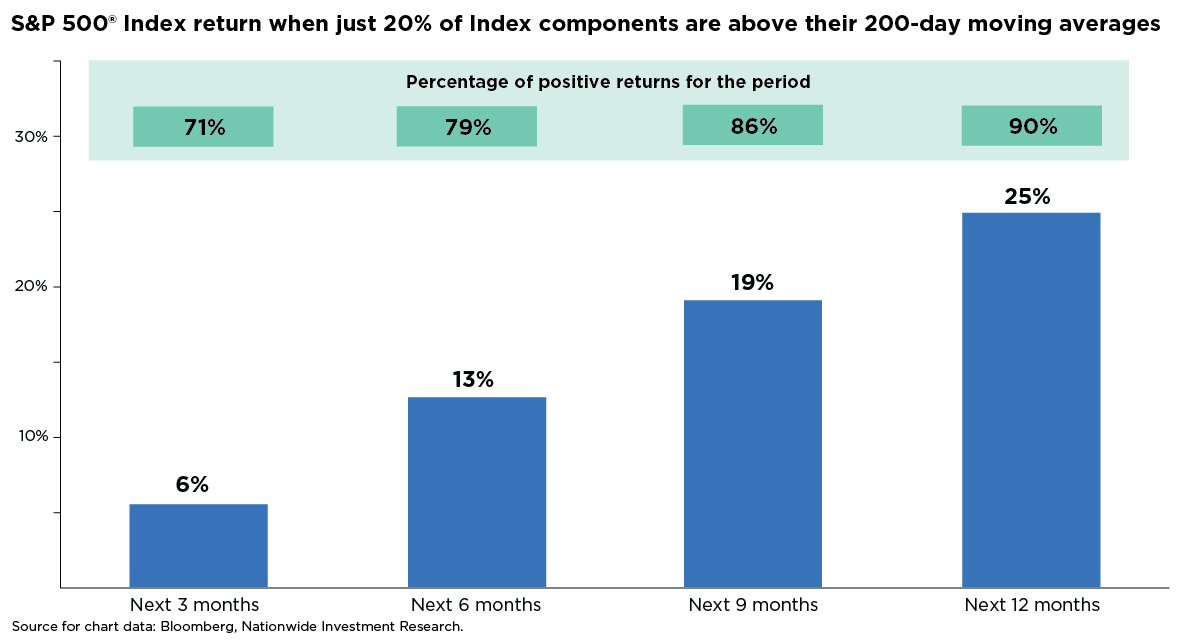
On April 8, only 18% of S&P 500 stocks traded above their 200-day moving average, a potentially contrarian signal showing that investor sentiment had likely swung too far to the pessimistic side. Historically, when fewer than 20% of stocks are above their 200-day moving average, a sign of potential capitulation—future returns for stocks are positive, as illustrated in the accompanying chart.
While historical data suggests better days ahead for stocks, financial professionals should temper client expectations for a V-shaped recovery, which is historically rare. Instead, consider the market as a coiled spring that snaps back from extremely pessimistic sentiment levels to eventually return to a more balanced equilibrium.
Contrarian signals like these can often precede significant market rebounds. This historical context underscores the importance of maintaining a long-term perspective, avoiding emotional reactions to market headlines, and staying invested in a well-diversified portfolio across different asset classes.
Author(s)

Mark Hackett, CFA, CMT
Chief Market Strategist, Nationwide Investment Management Group
Mark Hackett is the Chief Market Strategist for Nationwide’s Investment Management Group, bringing more than 20 years of experience in the asset management industry to the role.
Trending articles
In the coming years, more people will begin to think about the costs of health care in retirement and the possibility of needing long-term care (LTC) in the future, especially as the number of Americans reaching age 65 hits an all-time high this year.
Considerations for financial professionals on supporting retirees through economic uncertainty.
This guide explores strategies for securing long-term care for children with special needs through special needs trusts, ABLE accounts, and government benefits.