A long-term perspective can help
weather stock volatility
Key takeaways:
- The wave of announcements and headlines regarding tariffs has intensified the volatility of the recent downturn.
- While volatility is likely to persist in the near term, the historical performance of stocks during and after sharp downturns can provide some insights.
04/16/2025 – When the stock market appears to be in freefall, as it has for much of the last two weeks, investors often let emotions override reason, making investment decisions at the worst possible times. Persistent high levels of uncertainty in the markets and economy typically lead investors to reduce risk-taking behavior and lower their near-term outlook.
The recent wave of announcements and headlines regarding the Trump administration's tariff policy has intensified the volatility of this downturn. The intraday ranges of the S&P 500® Index during the recent sell-off have been remarkable: 8.5% on April 7, 7.3% on April 8, 10.8% on April 9 (the sixth strongest ever recorded), and 4.7% on April 10.
Investors are eager to understand the current situation, especially as the chances of rising inflation and slowing economic growth increase. Additionally, multiple indicators of market breadth continue to signal the potential for capitulation-driven stock selling.
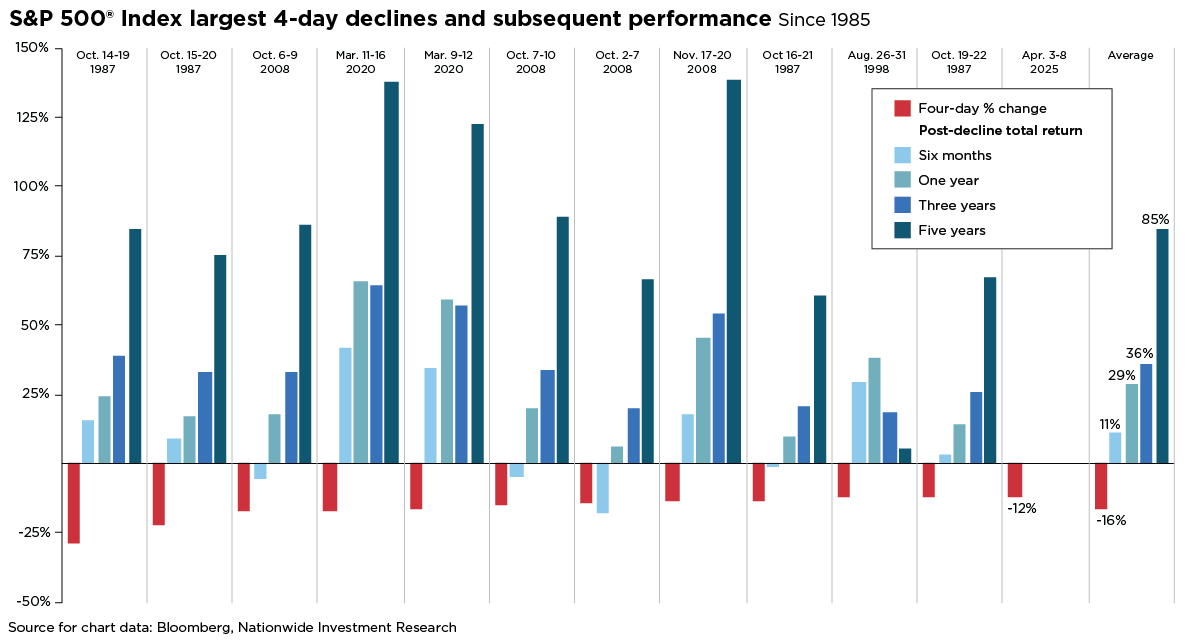
While volatility is likely to persist in the near term, the historical performance of stocks during and after sharp downturns can provide some insights. Although past performance does not guarantee future results, it suggests that stocks generally recover over time following significant declines.
For example, the market's preferred gauge of investor fear—the VIX—reached 50 on Tuesday, April 8. This level has been seen only three times since 1990. On each occasion, the S&P 500's return over the following 12 months was positive, with an average gain of 32%.
Similarly, some of the stock market's biggest short-term gains have occurred during periods of heightened volatility. Between April 3-8 this year, the S&P 500 experienced its twelfth-largest four-day decline since 1950—a historically rare contrarian indicator. However, on April 9, the S&P 500 surged 9.5%, marking its third-largest one-day gain since the 1950s. Additionally, the advance/decline ratio (which compares the number of stocks rising versus falling during the trading session) hit 34:1, the strongest move in favor of advancing stocks since October 2011.
It's important to emphasize that market volatility, while never comfortable, is normal. For investors seeking long-term growth, maintaining a long-term perspective, coupled with a strategy to manage volatility and the discipline to resist impulsive decisions, is the best approach to achieving their long-term goals.
Author(s)

Mark Hackett, CFA, CMT
Chief Market Strategist, Nationwide Investment Management Group
Mark Hackett is the Chief Market Strategist for Nationwide’s Investment Management Group, bringing more than 20 years of experience in the asset management industry to the role.
Trending articles
In the coming years, more people will begin to think about the costs of health care in retirement and the possibility of needing long-term care (LTC) in the future, especially as the number of Americans reaching age 65 hits an all-time high this year.
Considerations for financial professionals on supporting retirees through economic uncertainty.
This guide explores strategies for securing long-term care for children with special needs through special needs trusts, ABLE accounts, and government benefits.